Image Details
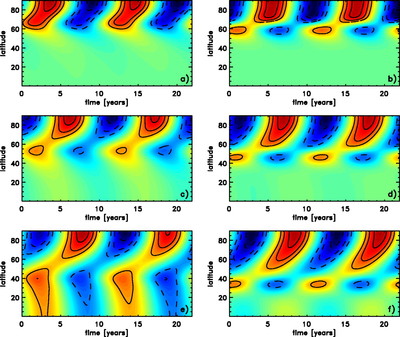
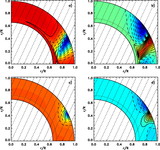
Caption: Fig. 2.
Torsional oscillations produced by periodic perturbations at a fixed location. The left panels (a, c, e) show the response to a periodic perturbation in the angular velocity (mechanical forcing), and the right panels (b, d, f) show the response to a periodic perturbation in entropy (thermal forcing). Solid contours correspond to positive values (faster rotation); dashed contours correspond to negative values (slower rotation). From top to bottom, the position of the perturbation in latitude is varied between 60° (a, b), 45° (c, d), and 30° (e, f). In all cases the strongest signal is found at the pole, independent from the location of the forcing. The power on the poleward side is always higher than on the equatorward side.
Other Images in This Article

Copyright and Terms & Conditions
© 2007. The American Astronomical Society. All rights reserved. Printed in U.S.A.