Image Details
Caption: Fig. 1.
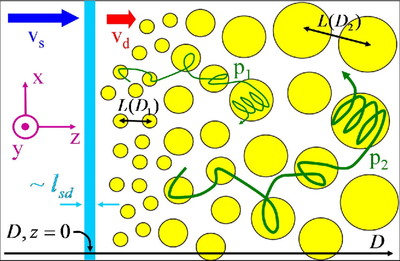
Schematic illustration of the model. The shaded vertical band at ﹩D=z=0﹩ represents the shock. Filled circles designate regions where the magnetic field amplitude B exceeds some constant threshold. The characteristic scale L for variations in B increases with distance D from the shock. Curved lines illustrate the trajectories of two high‐energy particles of different momenta, ﹩p_{1}< p_{2}﹩, becoming magnetized (﹩R_{\mathrm{L}\,}< L﹩) at two different scales.
Copyright and Terms & Conditions
© 2007. The American Astronomical Society. All rights reserved. Printed in U.S.A.
Copyright ©
2026 Astronomy Image Explorer. All Rights Reserved.